
Site Categorization
How we classify monitoring sites for clean, comparable data
We combine geospatial layers and machine learning to assign each coordinate to a category that reflects its local environment. That keeps your network balanced between hotspots and representative background sites.
Why categorization matters
Consistent categories let you compare pollution levels across contexts, evaluate interventions, and ensure models and policies are anchored in representative data.
Inputs
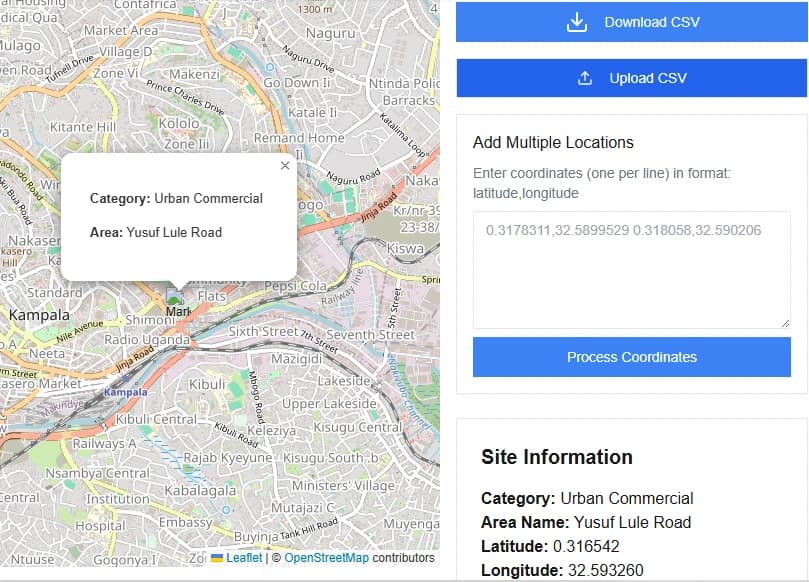
Single clicks on the map, CSV uploads of coordinates, or pasted lists. Optional: area of interest for focused analysis.
Outputs
Category, nearby context indicators, and rationale for each point—ready for download or immediate use.
Our approach
Data-rich context
Blend land use, road networks, night lights, vegetation, and industrial footprints to understand each site's environment.
Signal vs. background
Differentiate near-source hotspots from representative background areas so monitoring is balanced and meaningful.
Robust features
Use features resilient to noisy data: proximity bands, traffic intensity, urban density, elevation, and upwind/downwind cues.
Model transparency
Expose the evidence behind each classification so teams can trust the recommendation and override when needed.
What you get
Each run produces a transparent, defensible classification for every site. Results can be exported or iterated on as your network evolves.
- Category label for every coordinate: Urban, Urban Background, or Background
- Supporting attributes: nearest road class, land cover, and point-of-interest density
- Downloadable CSV of results for bulk uploads
- Interactive map to verify, edit, and re-run scenarios quickly
Built for planning and QA
Use the map to verify categories visually, override edge cases, and keep a clean audit trail for every decision.
Explainability
See the features and context that drove each classification.
Fast iteration
Rerun with new coordinate sets or AOIs in seconds.